


Lexa
Making a SaaS analytics dashboard clients could finally trust.
Project Overview
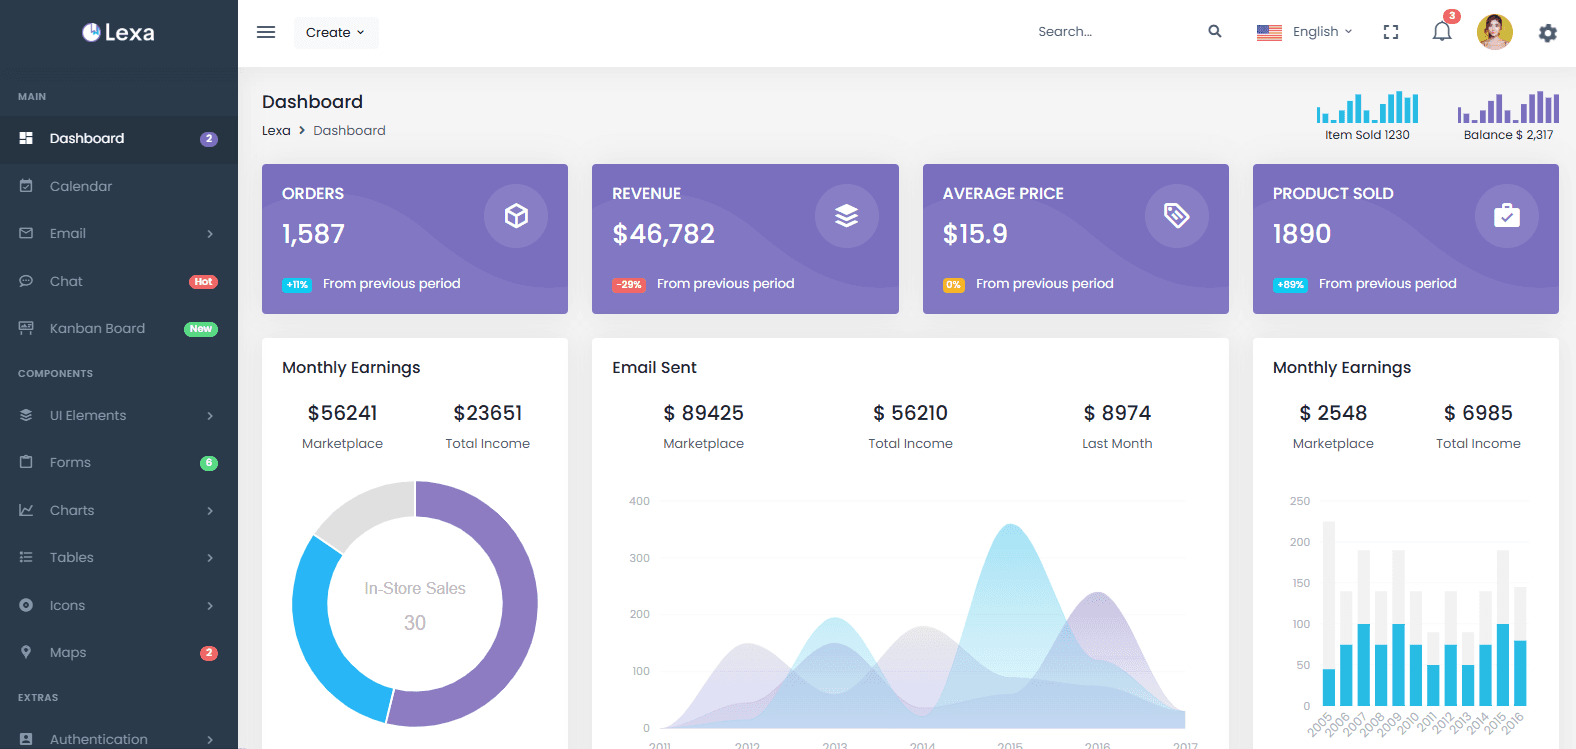
Lexa provides business analytics and SaaS management tools to mid-sized companies, and their biggest selling point was supposed to be clarity — helping clients understand their own data. The problem was, their own dashboard wasn't clear at all. Reports took too long to generate, data sometimes looked inconsistent between screens, and their sales team was losing deals because prospects didn't trust what they were seeing in demos. Lexa asked Global Digital Care to rebuild their core analytics dashboard using MERN Stack Web Development.
About the Client
Lexa sells a SaaS platform that helps businesses track performance metrics across sales, marketing, and operations in one place. Their customers are typically operations managers and business owners who don't want to jump between five different tools to understand how their company is doing. Lexa's value proposition depends entirely on the dashboard being fast, accurate, and easy to read.
Challenges Faced
Reports pulling from multiple data sources sometimes showed slightly different numbers depending on which screen you looked at.
Larger client accounts, the ones with more historical data, saw dashboard load times of 8 to 10 seconds.
The backend was a mix of different frameworks stitched together, which made bug fixes unpredictable.
There was no proper caching strategy, so the same calculations were being run repeatedly for every page load.
The admin side lacked meaningful audit logs, making it hard to troubleshoot client-reported issues.
Our MERN Stack Solution
We proposed a rebuild centered on MERN Stack Web Development because it let us unify the data layer while giving the frontend room to handle complex visualizations smoothly. MongoDB was a strong fit for Lexa's varied metric types, React.js gave us the ability to build a dashboard that felt instant, and Node.js with Express.js let us consolidate several disconnected backend services into one consistent API layer.
Development Process
Planning
We spent the first two weeks auditing Lexa's data pipelines, tracing exactly where numbers diverged between screens. We found three separate places where calculations were happening slightly differently, which explained months of inconsistency complaints.
UI/UX Design
The redesign focused on visual hierarchy, restructuring the dashboard so the most important KPIs sat at the top, with drill-down details on click and consistent chart styling across the platform.
Frontend Development (React.js)
We rebuilt the dashboard using React.js with a component library specific to Lexa's chart types, plus skeleton loading states so the dashboard felt responsive even while larger datasets were still loading.
Backend Development (Node.js & Express.js)
The backend was consolidated into a single Node.js and Express.js service with one clear source of truth for each calculation, eliminating the inconsistency issue at its root.
Database (MongoDB)
We restructured Lexa's MongoDB collections around how reports were actually queried, with targeted indexing and a caching layer for commonly requested date ranges.
Testing & Deployment
We ran side-by-side comparisons between the old and new dashboards using real client accounts, checking every number matched exactly, then deployed gradually, account by account.
Key Features Delivered
A unified analytics dashboard with consistent numbers across every screen
Custom report builder for client-specific KPIs
Role-based admin access with audit logging
Significantly faster load times for large accounts
Cached reporting for common date ranges
Export functionality for client-facing reports
Results & Business Impact
Once the new dashboard went live, report generation time dropped by around 65% for large accounts. The data inconsistency complaints disappeared almost entirely, since every report now pulled from the same calculation layer. Lexa's sales team reported smoother demos, and client retention improved in the months following launch.
Key Takeaways
Performance problems and trust problems are usually connected. Clients don't just want a fast dashboard, they want a dashboard they can believe. Fixing the underlying data architecture mattered just as much as the visual redesign. Consolidating scattered backend logic into one clear system, even when it takes longer upfront, saves enormous time down the road.
Conclusion
Lexa's story is a good reminder that a SaaS product is only as strong as the data behind it. By rebuilding the platform with MERN Stack Web Development, Global Digital Care helped Lexa turn their dashboard from a liability into a genuine selling point.
Ready to build your own success story?
If your business needs a fast, scalable web application, Global Digital Care can help with expert MERN Stack Web Development from planning through launch.
Talk to Global Digital Care